Logging in Dask
When writing code a natural method of keeping track of how code runs is through logging. Typically in Python, logging is done using the built in logging module, like this:
import logging
logging.warning('This is a warning')
logging.info('This is non-essential info')
Unfortunately, if you try and use this style of logging from within a @dask.delayed function, you won’t see any output at all. You won’t see it in the console if you’re running a Python script nor will you see it after a cell within a Jupyter Notebook. This is also the case for print functions–they won’t be captured if they are run within a @dask.delayed function. So an alternate approach is needed for logging within Dask.
Instead, to do logging we’ll need to use the distributed.worker Python module, and import logger. This will give us a logging mechanism that does work in Dask. Here is an example of it in action.
import dask
from distributed.worker import logger # required for logging in Dask
from dask_saturn import SaturnCluster
from dask.distributed import Client

cluster = SaturnCluster()
client = Client(cluster)

@dask.delayed
def lazy_exponent(args):
    x,y = args
    result = x ** y
    # the logging call to keep tabs on the computation
    logger.info(f"Computed exponent {x}^{y} = {result}")
    return result

inputs = [[1,2], [3,4], [5,6], [9, 10], [11, 12]]

example_future = client.map(lazy_exponent, inputs)
futures_gathered = client.gather(example_future)
futures_computed = client.compute(futures_gathered, sync=False)

results = [x.result() for x in futures_computed]
results

client.close()
The logs generated using distributed.worker won’t show up in the console output or in a Jupyter Notebook still. Instead they’ll be within the Saturn Cloud resource logs. First, click the “running” link on the Dask cluster of the resource you’re working in:
[DASK CLUSTER]
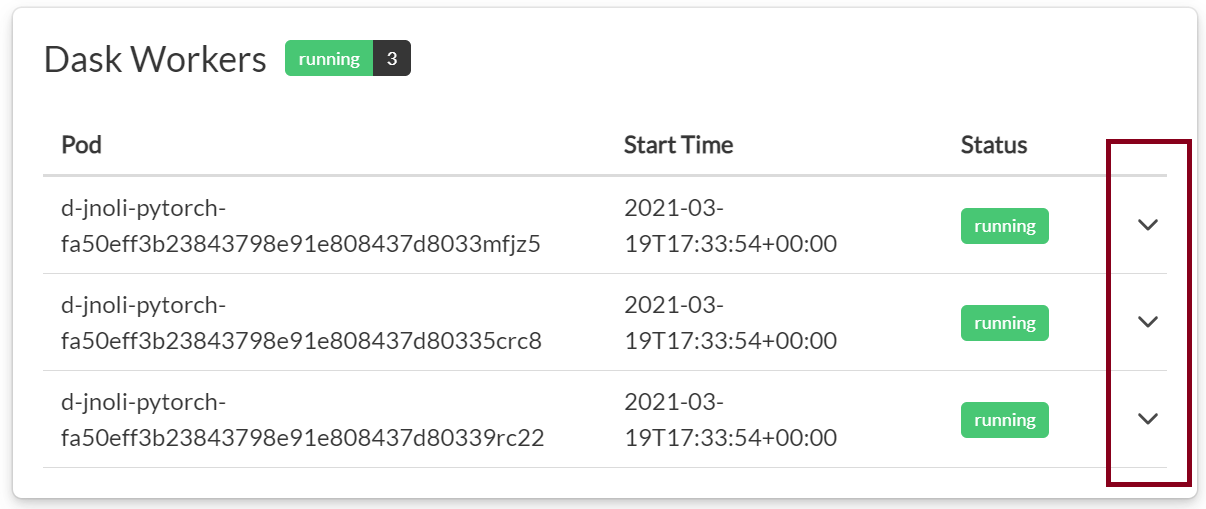
From there, expand each of the Dask workers. The logs from each worker are stored individually, and when you write code you won’t know which worker it will end up being executed on:

Those will show the logs created by the Dask worker. Notice that there is lots of information there, including how the worker was started by Dask. Near the bottom you should see the logs we wanted, in this case the ones generated by lazy_exponent:
distributed.worker - INFO - -------------------------------------------------
distributed.worker - INFO -               Threads:                          4
distributed.worker - INFO -                Memory:                   15.50 GB
distributed.worker - INFO -       Local Directory: /tmp/dask-worker-space/worker-1ggklqmo
distributed.worker - INFO - Starting Worker plugin <dask_cuda.utils.CPUAffinity object at 0x7fcf3508a-4bbdb030-ec01-4b2e-bc94-d12ba7418478
distributed.worker - INFO - Starting Worker plugin <dask_cuda.utils.RMMSetup object at 0x7fcf8ca5b390-03909dd1-c3e3-4bde-b721-067f3977b005
distributed.worker - INFO - -------------------------------------------------
distributed.worker - INFO -         Registered to: tcp://d-user-pytorch-fa50eff3b23843798e91e808437d8033.main-namespace:8786
distributed.worker - INFO - -------------------------------------------------
distributed.core - INFO - Starting established connection
distributed.worker - INFO - Starting Worker plugin saturn_setup
distributed.worker - INFO - Computed exponent 11^12 = 3138428376721
distributed.worker - INFO - Computed exponent 5^6 = 15625
There we correctly see that the logs included the info logging we did within the function. That concludes the example of how to generate logs from within Dask. This can be a great tool for understanding how code is running, debugging code, and better propagating warnings and errors.
Need help, or have more questions? Contact us at:
- support@saturncloud.io
- On Intercom, using the icon at the bottom right corner of the screen
We'll be happy to help you and answer your questions!
